
Share this
by Omnidots on Sep 17, 2024 3:59:42 PM
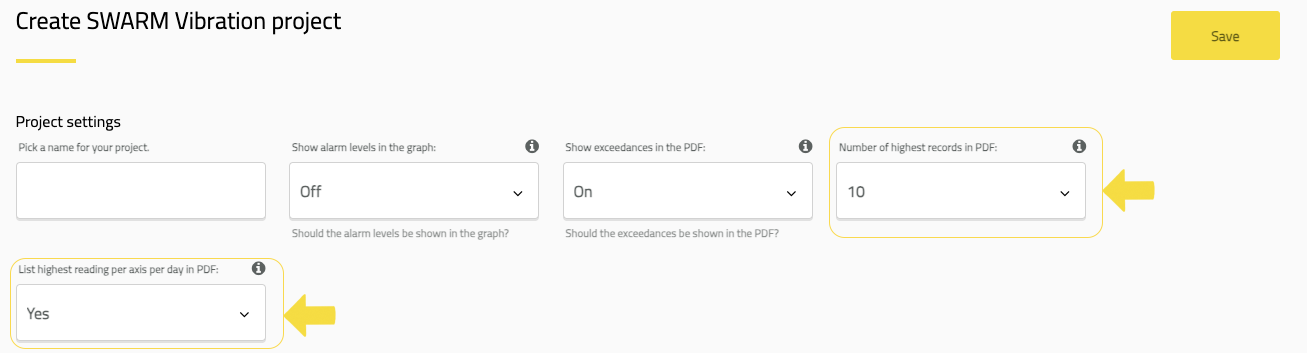
As a Honeycomb user, you now have access to a new feature that allows you to review peak vibration readings over a specific period of time. These new settings enable you to generate automated and custom reports that display various peak values recorded during the chosen time frame. Additionally, the update includes additional features such as:
- Peak vibration on each axis
- Top 10 vibration levels per axis
- Top 20 vibration levels per axis
These values are helpful during the reporting and review process. By highlighting the peak values, you can quickly reference how high vibrations were reached during that time period without combing through the full data set. To enable these settings for a new or existing project, simply enter the Project - Configurations and adjust the two dropdown options at the top of the configuration page for “Number of highest records in PDF” and “List highest reading per axis per day in PDF.”
As with all project settings on Honeycomb, changes only affect data after they are made, so peak readings will not be available for historic data. This is done intentionally to ensure that all data is presented as it was collected. Data collected after this setting is applied can be included in automated daily or weekly reports or custom timelines using the export PDF function in Graphs.
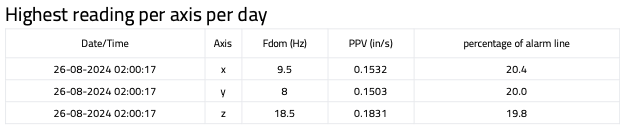
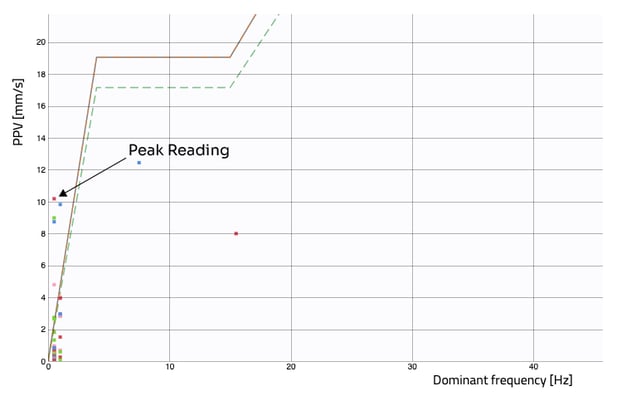
Additionally, since many vibration guidelines have a frequency and velocity component, Omnidots designed this peak reading feature to report the vibration reading with the highest “percentage of alarm line.” In some cases, as presented below, the peak reading may not be the highest reading for the period selected but, instead, the event that exceeds the threshold the most.
In the example below, the peak at 10 mm/sec exceeded the threshold, but the highest reading at 12.5 mm/sec did not. By activating the top 10 or top 20 readings function, you should capture all high-level readings in the report. The top 10 and top 20 functions list the vibration results in order of “percentage of alarm line” as well.
Reference Image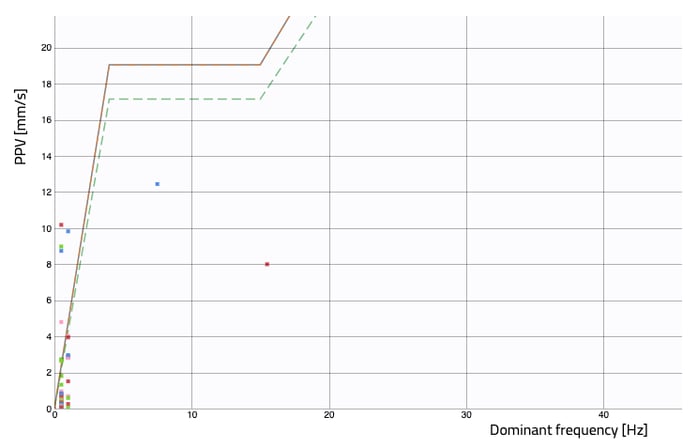

If you ever encounter issues, have questions, or want to share feedback, please don't hesitate to contact us. We're always ready to help.