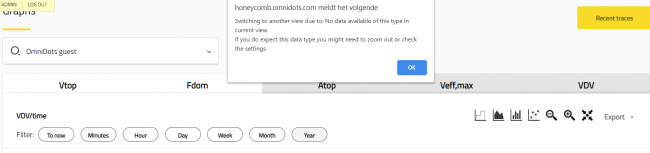
When you have a project with multiple data logging methods (for example, PPA and PPV), the graph automatically switches to the tab with collected data. The tabs containing any data will be highlighted in white. The tabs without data will be highlighted in gray. This is helpful when you need to quickly access data that has already been logged into the graph.
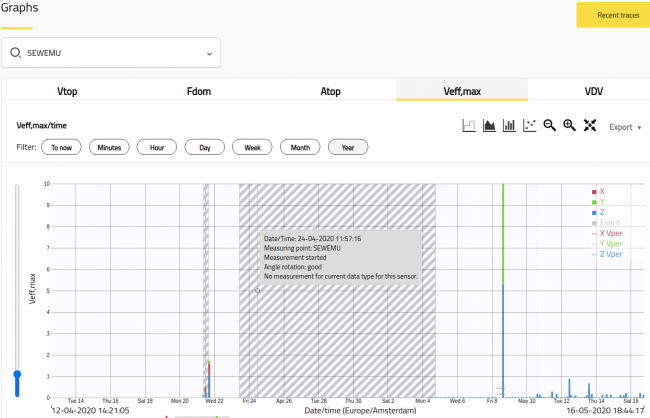
Previously, when you were looking at the graph for a specific data type while measuring a different data type (e.g., viewing Vtop while monitoring Veff), there was no indication that you were viewing a graph for which no data was being collected. From now on, a gray-striped pattern and a short note will show up when you are viewing an inactive graph.
Therefore we added another striping pattern along with a bit of text in the tooltip to show that.