
In this news message, we will tell you about the latest additions in Honeycomb, which are essential for your way of measuring.
Share this
by Omnidots on May 1, 2020 12:00:00 AM
What your SWARM measures now
Your Omnidots SWARM measures the Vtop (PPV / Peak Particle Velocity) and the Atop (PPA / Peak Particle Acceleration) for guidelines SBR-A, DIN4150-3, and BS7385. For SBR-B, your SWARM measures the Veff max (maximum effective speed), and for DIN4150-2, your SWARM measures the same value; only then it is called KBF max (maximum weighted vibration severity). For BS6841, ISO2631, ISO5349, and ISO8041, your SWARM measures the VDV (Vibration Dose Values).
You can download all measurement data as CSV, Excel, or via the Omnidots API. You can generate notifications for Vtop (PPV) and possibly for Atop (PPA) in Honeycomb if you choose SBR-A 2017 foundation as the setting.
New feature: all data in the graph
Since April 27, all Omnidots measurement data has become available in graphs. You can view these graphs by clicking on the tabs. The tabs were not there before, and only Vtop (PPV) could be viewed in the graph. The graphs, therefore, are considerably expanded so that you can make better and even more complete reports using all guidelines available from Omnidots. 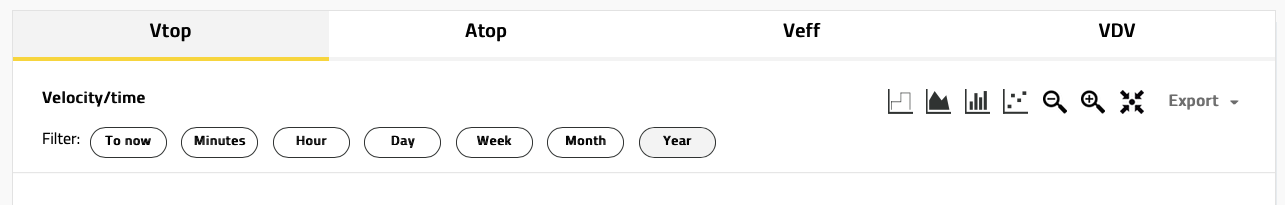
Next week: New "KBFTm" data in the table below and the Veff graph
As of next week, Honeycomb will show Vper in a table below the graph for SBR-B and DIN4150-2. Honeycomb will also show KBFTm. KBFTm is the RMS value of the KBFmax values over the measurement period. KBFmax is the maximum weighted vibration severity. These KBFTm are plotted with the Veff graph, in addition to the KBFmax values that were already there.
Extra graph for display KBFTm per part of the day
In a few weeks, Honeycomb will show an extra graph below the current graph when Veff is chosen. This is similar to when you select Vtop now. A second speed/frequency graph is shown below the Vtop graph. Vper, measured values are shown in that additional graph.
You will also find in the table whether an exceedance has occurred on a specific part of the day. To achieve this, we expand the settings page of a measuring point. In addition to choosing "SBR-B" or "DIN4150-2", you will also receive questions about the type of measurement in accordance with the respective guidelines.
We continuously expand our services by optimizing Honeycomb without you having to make an extra investment. In this way, we can provide you with the best possible service. Do you have any questions after reading this article? Our technical support team is at your service. You can reach them via chat at omnidots.com. Do you have a question for our sales team? Please mail to sales@omnidots.com or call your contact person.