If you have questions about this new feature or the Honeycomb platform, we would be happy to schedule a meeting with you!

by Omnidots on Jun 14, 2022 12:00:00 AM
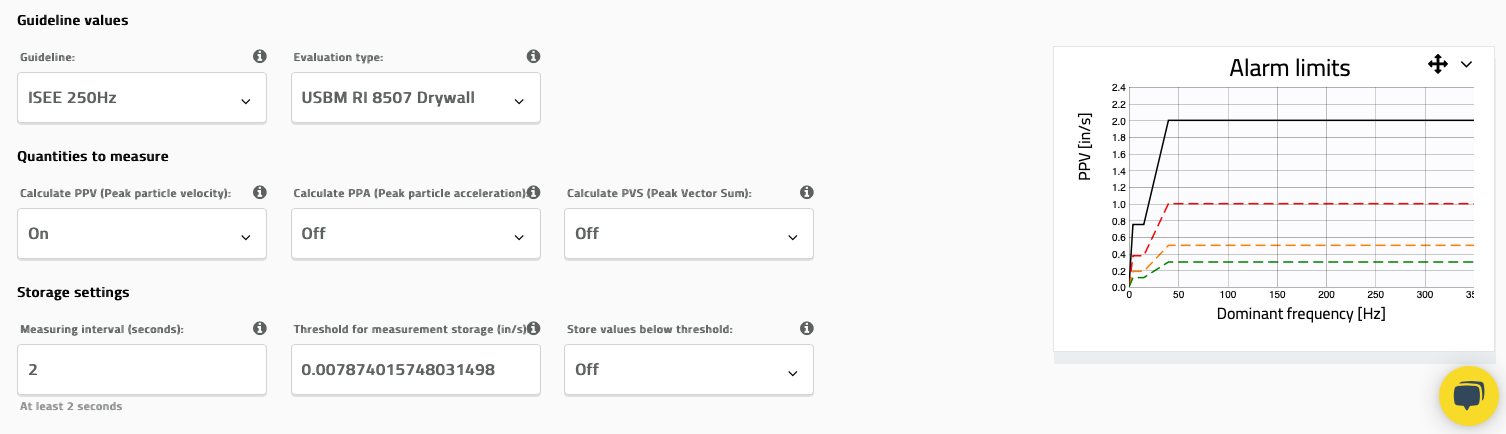
Configuring your SWARM to monitor vibrations is now easier than ever with the Honeycomb graph preview. The new feature shows you what your alarm limits would look like as you create a measuring point. You no longer need to run a trial measurement to determine if you set the alarm thresholds correctly. Instead, you can check if they align with your plans and relevant guidelines as you configure the SWARM. Ensuring that alerts are sent out at the right time just became a lot more convenient.
You can find the new Graph Preview on the 'Create measuring point' page in Honeycomb:
If you have questions about this new feature or the Honeycomb platform, we would be happy to schedule a meeting with you!