Software
The Honeycomb web platform allows you to access your measuring data and SWARM settings 24/7, from all over the world and on all of your devices.
Discover Honeycomb
Hardware
About our efficient environmental monitoring solution for the construction and infrastructure industry.
All products
Latest success story
Daily site visits were draining time and resources—until R.W. Gillespie & Associates discovered Omnidots. They’ve cut travel, boosted efficiency, and expanded their reach with remote access, real-time alerts, and effortless reporting.
👉 See how innovation replaced frustration
Vibration monitoring sensors
MEMS technology has been thought to be inferior in vibration monitoring for construction, but is this really the case?
Read more
Who we are
Innovation, quality, and enthusiasm are Omnidots' core values. Read more about who we are!
About us
Support
How-to articles and FAQ for getting started with the Honeycomb web platform and our SWARM devices.
Support center
by Omnidots on Mar 9, 2021 12:00:00 AM
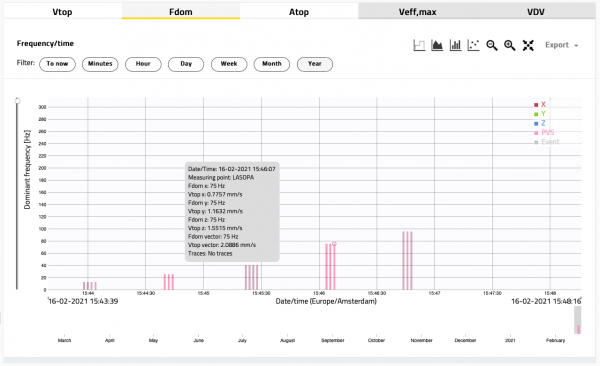
Image 1: Barchart of PVS in the Honeycomb Graph
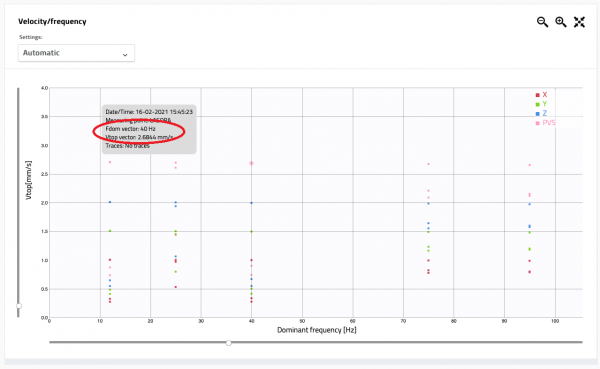
Image 2: Chart and data of PVS in the Honeycomb